Analyze MaxDiff — clear preferences, not scale bias
Analyze your MaxDiff survey (best-worst scaling) with count, aggregate logit and random-parameter logit — on the R engine, directly on your data. A clean ranking of what really matters. No export.
DataLion analyzes MaxDiff surveys (best-worst scaling) with three procedures on the R engine: count analysis (best−worst), aggregate logit and random-parameter logit. This gives you a clear, scale-free ranking of how important individual items really are to respondents — directly on your data.
- 🇩🇪 Made in Munich
- GDPR-compliant
- DPA included
- Hosted in Germany
Trusted by research, insights & media teams
- 50+ interactive chart types
- 20+ statistical methods
- SPSS · Excel · CSV import without data loss
- ISO 27001 certified data centers (Germany)
Measure preferences without everything being "important"
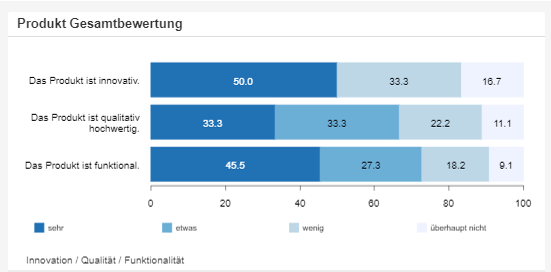
Classic importance scales suffer from acquiescence bias: in the end (almost) everything is "very important". MaxDiff (best-worst scaling) forces respondents into real trade-offs — for each set they pick the most and the least important item.
The result is a scale-free, clear ranking that compares cleanly across countries and audiences. DataLion computes the analysis right in the tool.
- Forced trade-offs instead of "everything important"
- Scale-free, comparable ranking
- Robust across countries and audiences
- Analysis directly in DataLion
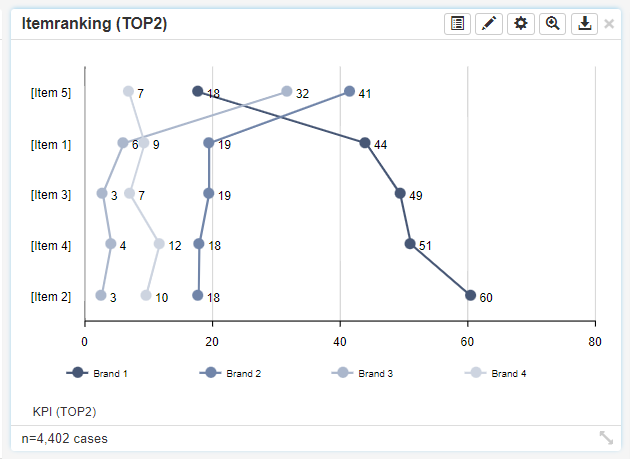
Count, aggregate logit and random-parameter logit
DataLion ships three MaxDiff procedures on the R engine: count analysis (best−worst) for a fast, intuitive ranking, aggregate logit for a robust overall estimate, and random-parameter logit, which accounts for heterogeneity across respondents.
You pick the procedure to match your need — from a quick count analysis to a nuanced estimate of individual preference differences.
- Count analysis (best−worst) for fast rankings
- Aggregate logit for robust overall values
- Random-parameter logit for heterogeneity
- Choose the procedure to match your need
From feature prioritization to claim tests
MaxDiff answers prioritization questions: which features, messages, benefits or claims matter most to respondents? Which can you drop? The ranking can be broken down by segment and analyzed further via crosstabs.
This page describes the analysis technique. For the full use case — from study setup to analysis — see the Conjoint & MaxDiff solution page.
- Feature, benefit and claim prioritization
- Break the ranking down by segment
- Process further in crosstabs and charts
- Full use case under Conjoint & MaxDiff
See DataLion with your own data
Start a free trial or book a personal demo — from raw data to a finished dashboard.
What users say about DataLion
-
Very professional company, attentive to the customer needs, provider of a great software and service.
Generoso M. CRM Analyst · Automotive via G2 -
The contacts at DataLion are very committed. If you have problems, you can count on help. DataLion reacts quickly to requests for new functions.
Robert Q. Managing Director via G2 -
User-friendliness, especially for market research topics. Structured backend with many customization options.
Verified user Market Research via G2 -
The embedding function allows us to generate insights of our data for our audience and customers by far less than half of the usual time needed before.
Verified user Leisure, Travel & Tourism via G2

We now work much more efficiently, giving us more time to take care of the derivations and insights from the data for the customers.
More analysis features
Common questions about MaxDiff analysis
Which MaxDiff procedures does DataLion offer?
What is the advantage of MaxDiff over importance scales?
What is the difference from the Conjoint & MaxDiff page?
Can I analyze MaxDiff results by segment?
Do I need to export data or know R?
Analyze your MaxDiff study
Try DataLion free: count, aggregate logit and random-parameter logit directly on your data — with no export. Or book a personal demo.