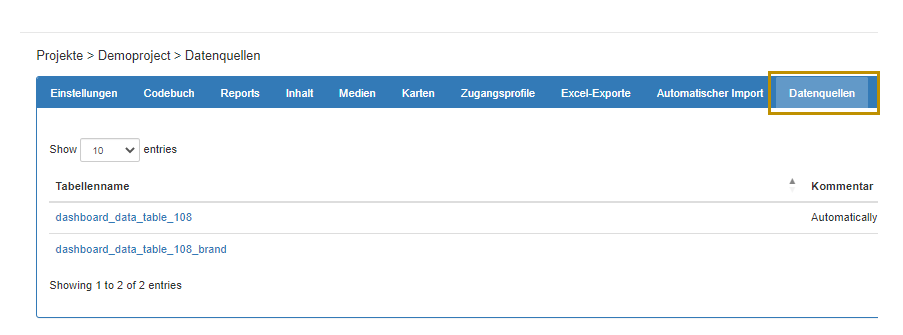
Sales Dashboards & Analytics
Turn your CRM, web and finance data into live sales dashboards — and keep pipeline, win rate and revenue in view in real time. Build the board deck in one click. ISO 27001-certified hosting, GDPR-compliant, made in Munich.
DataLion is a web-based dashboard platform, made in Munich, that turns your sales data into interactive dashboards. Import pipeline and revenue data from your CRM, web tracking and finance tools, then track win rate, quota attainment and forecast in real time — and export board-ready PowerPoint in one click. ISO 27001-certified hosting and GDPR-compliant.
- 🇩🇪 Made in Munich
- GDPR-compliant
- DPA included
- Hosted in Germany
Trusted by research, insights & media teams
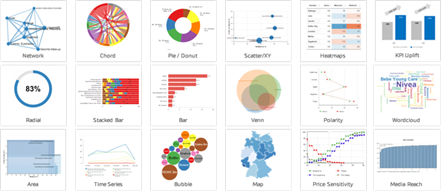
- 50+ interactive chart types
- 20+ statistical methods
- SPSS · Excel · CSV import without data loss
- ISO 27001 certified data centers (Germany)
The Monday-morning sales report problem
- Pulling pipeline numbers out of the CRM and into a deck eats the same hours every single week.
- Different teams quote different numbers because the report is rebuilt by hand each time.
- By the time the board deck is ready, the forecast it shows is already out of date.
From CRM export to live dashboard — without copy-and-paste
Sales reporting usually means pulling numbers from the CRM, pasting them into Excel, building charts and rebuilding the same deck every week. DataLion unites that chain in one platform — connect your data once and your dashboards update themselves.
Bring pipeline and revenue data from your CRM together with web tracking, ad and finance data, and give every level — from rep to board — the view they need, live and on any screen.
- CRM, web, ad and finance data combined in one cockpit
- Dashboards built by drag & drop — no programming, no manual
- Live filters & drill-downs, mobile and fullscreen ready
- Embed live dashboards in your intranet or sales portal
What is a sales dashboard?
A sales dashboard is an interactive cockpit that brings your most important revenue metrics into one place and presents them graphically. Instead of hunting figures across the CRM, spreadsheets and BI exports, you get pipeline, win rate, quota attainment and forecast at a glance — and drill down into the detail.
That is how you answer the questions that decide the quarter: which regions and reps are on track? Where is the pipeline thin? Which products and segments convert best — and how does the forecast compare to target?
- All revenue KPIs in one cockpit instead of scattered exports
- Answers to concrete questions about pipeline, conversion and forecast
- Drill down from the global number to a single rep or deal stage
- Self-service for sales leaders — no analyst in the loop
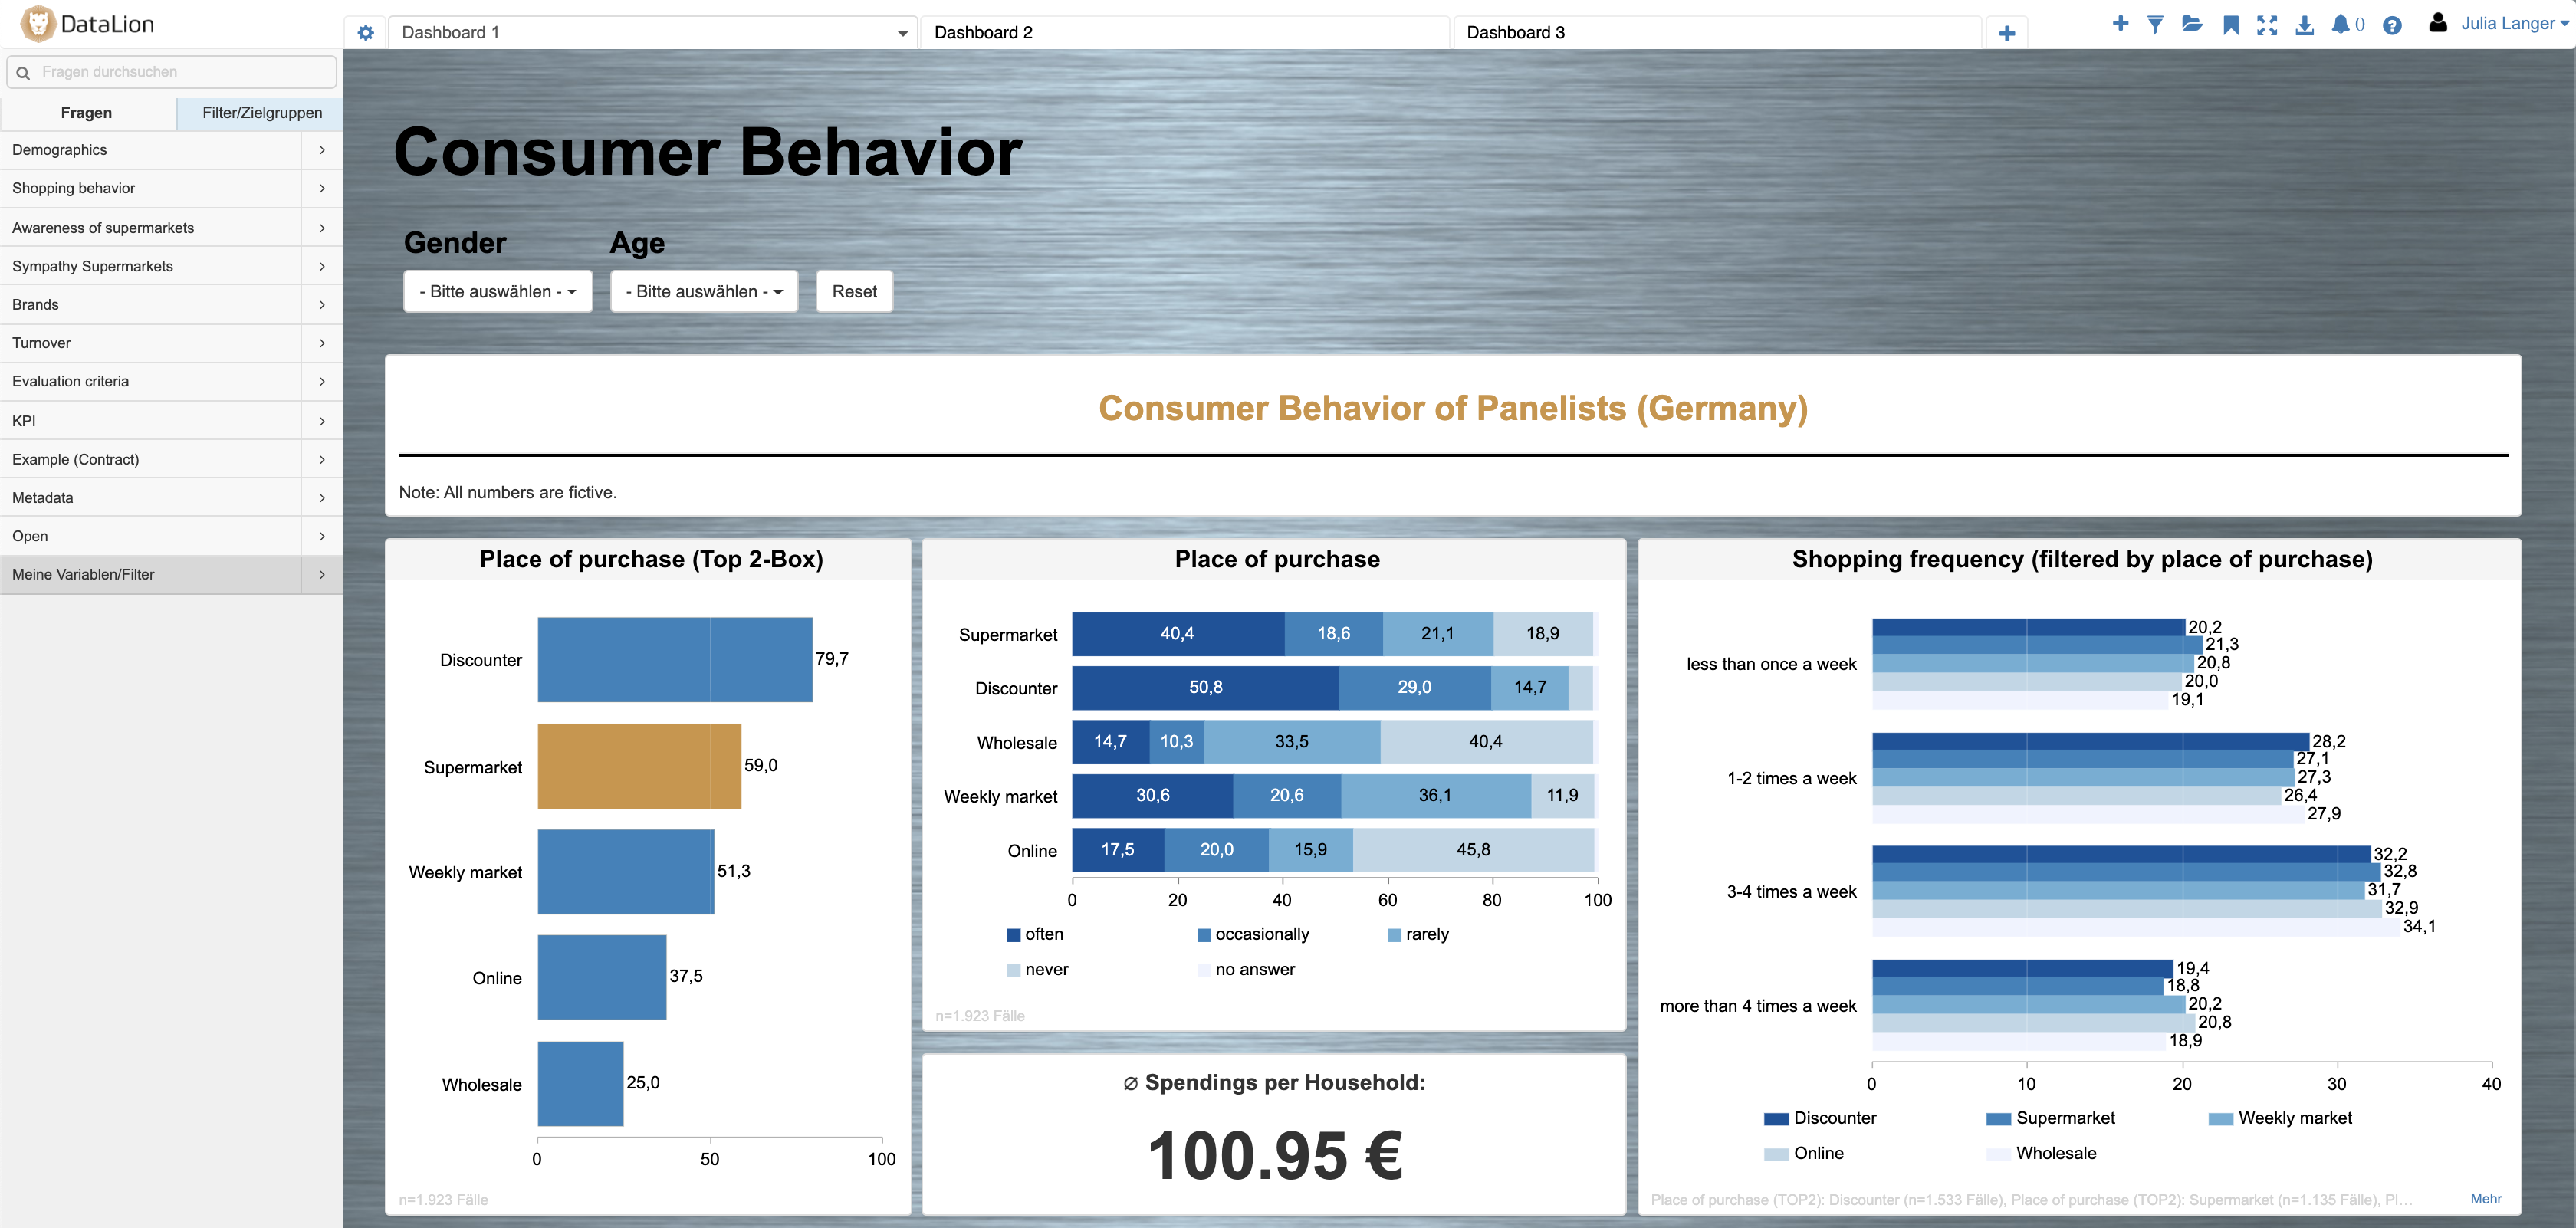
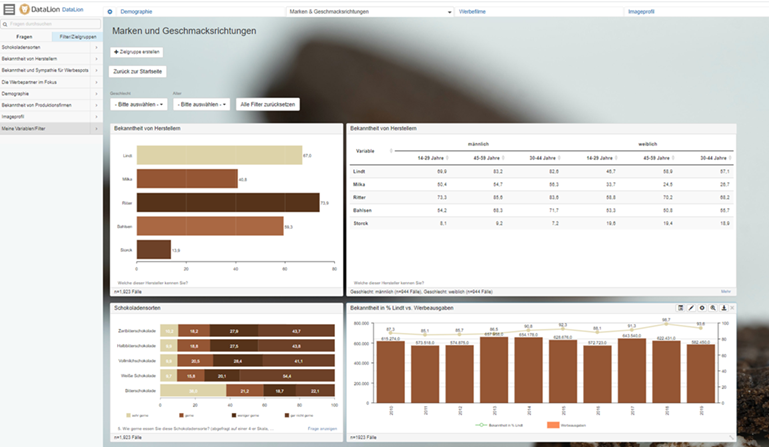
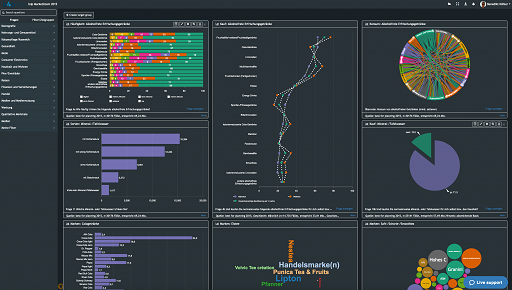
Pipeline, win rate & revenue — visualized
Put the metrics that matter on a live dashboard: pipeline value and coverage, win rate, average deal size, sales-cycle length, quota attainment and revenue vs target. Filter live by region, team, rep, product or segment and compare periods across flexible time series.
More than 50 interactive chart types cover every question — from funnels, bars and donut to heatmaps and time series — so a pipeline funnel, a win/loss breakdown and a regional revenue map all live on the same screen.
- Pipeline coverage, win rate, deal size, sales cycle & quota attainment
- Funnels, win/loss breakdowns and regional revenue maps
- Filter by region, team, rep, product or segment in real time
- Flexible time series for forecast vs actual, wave after wave
Import from your CRM, web & finance tools
Bring your sales data in from wherever it lives: databases, Excel and CSV, as well as live data sources. So CRM exports, web and ad tracking, social-media monitoring and finance KPIs all land in the same model — no copy-and-paste.
Once connected, dashboards refresh automatically as new data arrives, so the Monday pipeline review and the live revenue board are always current.
- Import via database, Excel or CSV and live data sources
- Combine CRM, web/ad tracking, social monitoring & finance data
- Auto-refresh — dashboards stay current with no manual rebuild
- Map your fields once and reuse them across every dashboard
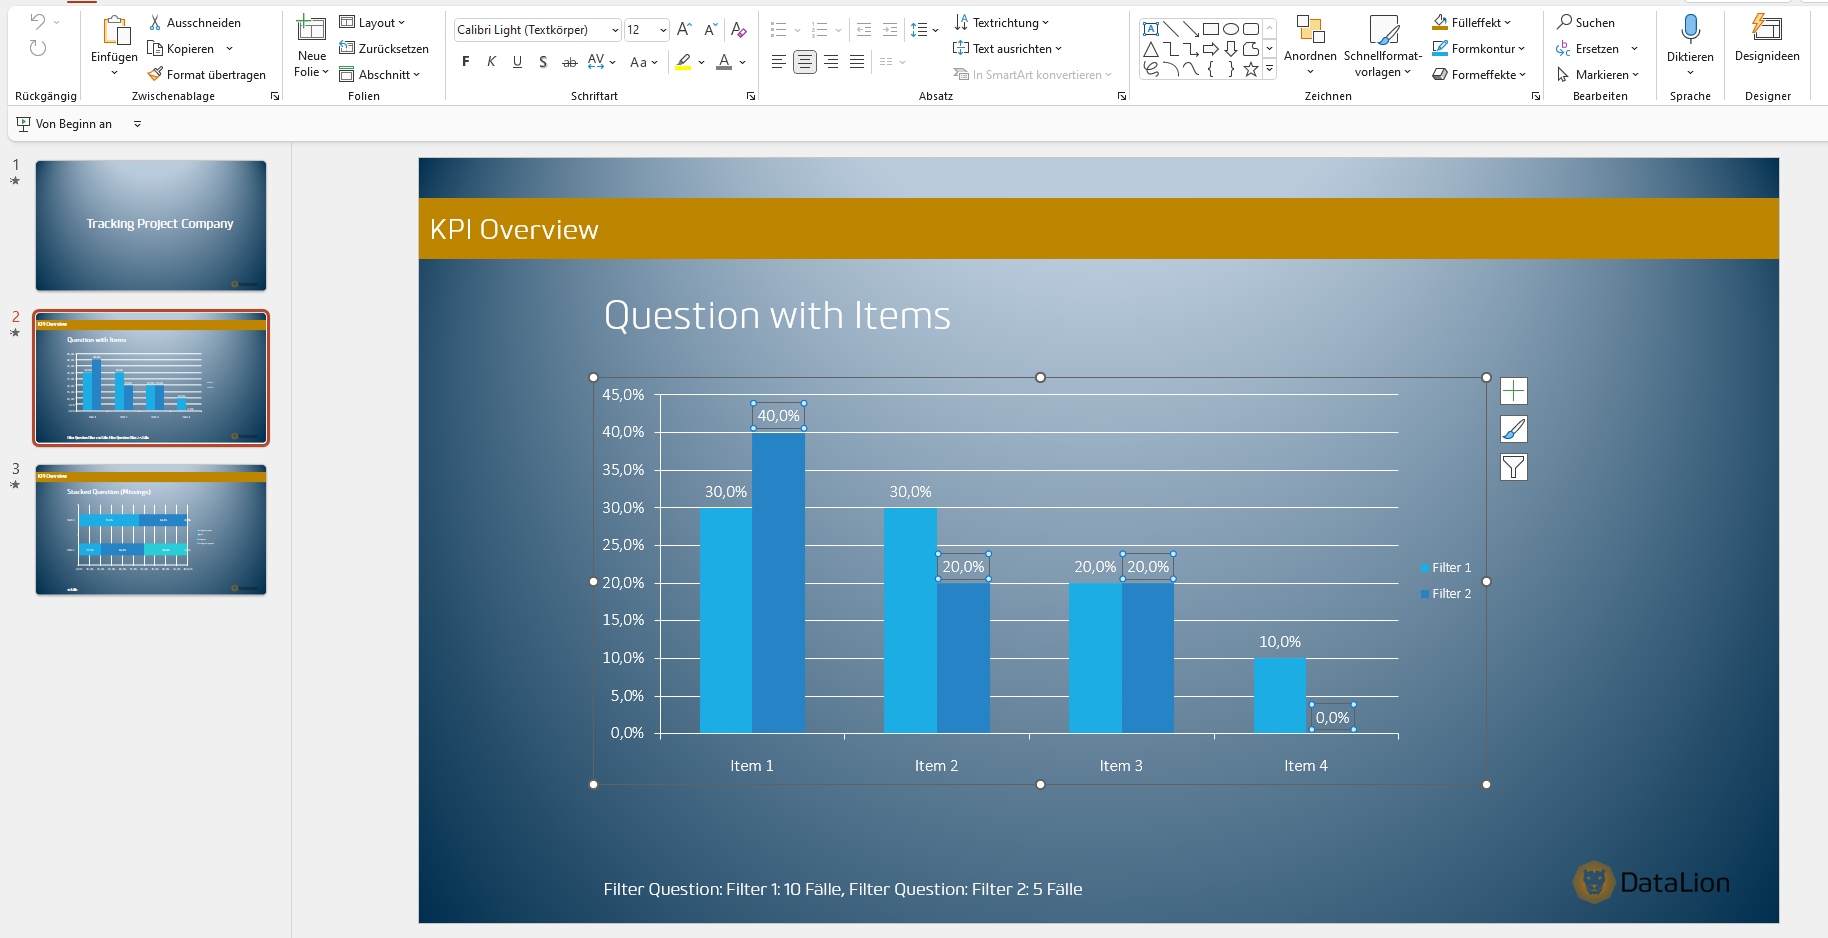
QBR & board decks in native PowerPoint
Export your sales report in one click as natively editable PowerPoint with any number of slides. Unlike many tools, charts come in as real PowerPoint diagrams — and with your own PowerPoint master the QBR or board deck already matches your corporate design.
Need the numbers raw? Export flexible Excel report books, PDF or images too. Once set up, the deck refreshes itself for the next review — no rebuild.
- Real PowerPoint diagrams with your own master
- Flexible Excel report books, PDF, CSV & image export
- Reports refresh automatically for the next QBR
- Share live dashboards by link instead of emailing slides
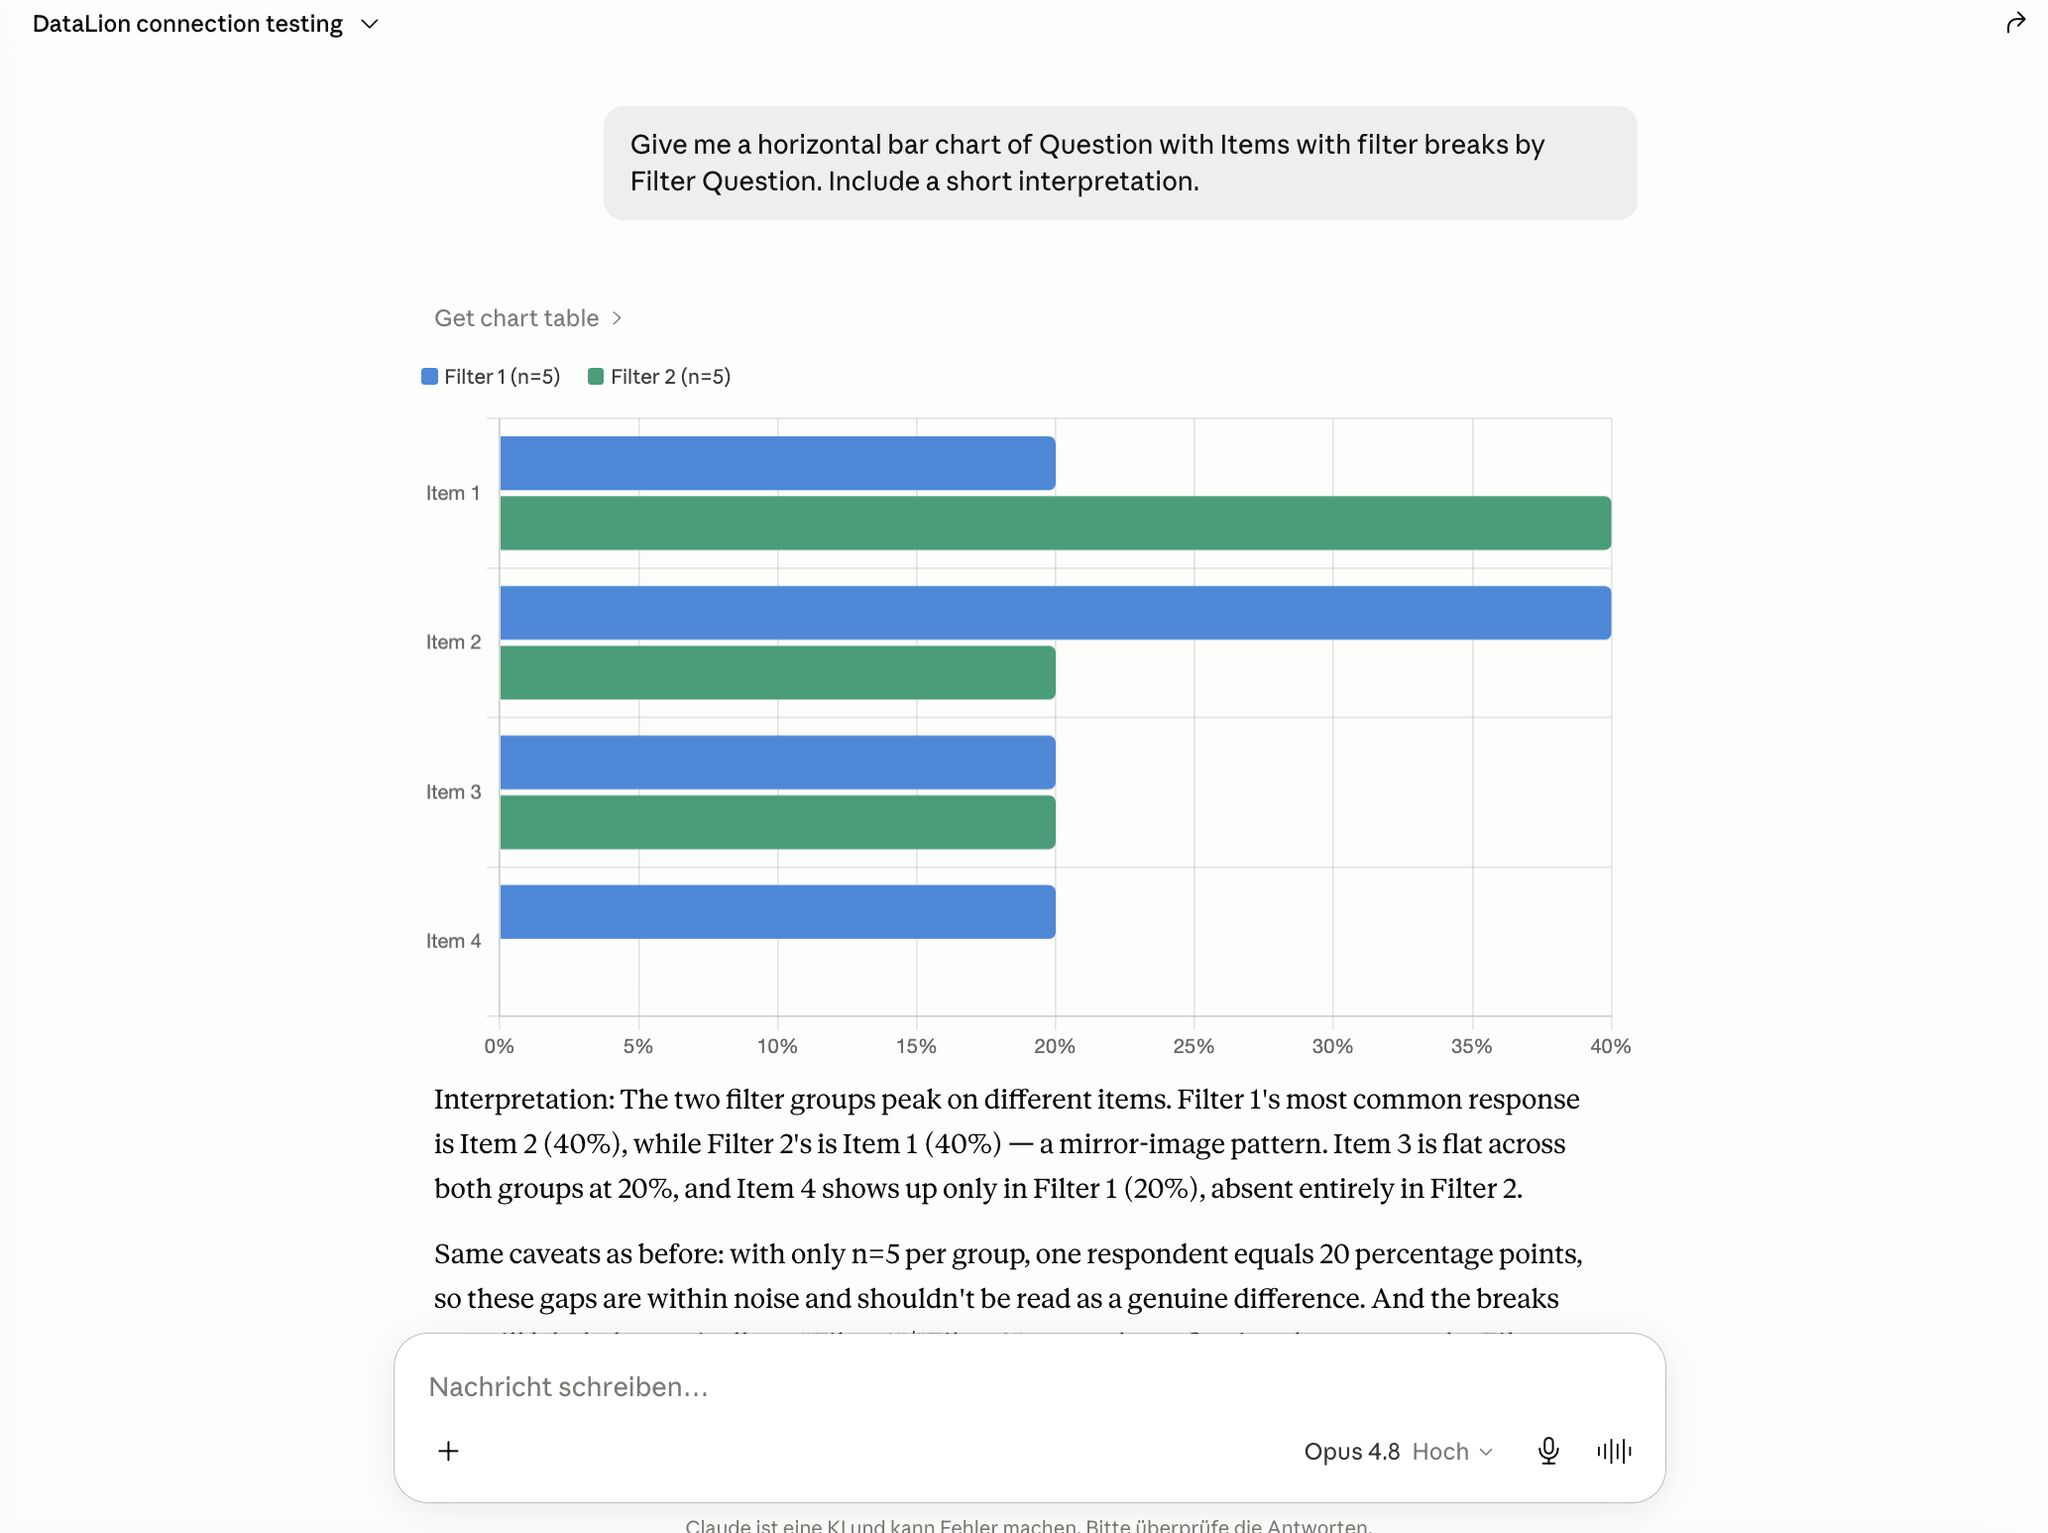
Ask your sales data in plain language
Through the Model Context Protocol (MCP) you connect DataLion to AI agents like Claude — and have them build dashboards, import data and create reports for you, described in plain language. The integration starts read-only, with scoped API tokens, so your revenue data stays under control.
Your sensitive pipeline and customer data is in safe hands: DataLion runs in ISO 27001-certified data centers in Germany, is 100% GDPR-compliant and ships with a Data Processing Agreement. Learn more on the AI & automation page.
- MCP integration for Claude & other AI agents — read-only by default
- Scoped API tokens; sensitive data stays under your control
- ISO 27001-certified data centers in Germany, 100% GDPR-compliant
- A new DataLion version every two weeks
What you can build with DataLion
See DataLion with your own data
Start a free trial or book a personal demo — from raw data to a finished dashboard.
What users say about DataLion
-
Very professional company, attentive to the customer needs, provider of a great software and service.
Generoso M. CRM Analyst · Automotive via G2 -
The contacts at DataLion are very committed. If you have problems, you can count on help. DataLion reacts quickly to requests for new functions.
Robert Q. Managing Director via G2 -
User-friendliness, especially for market research topics. Structured backend with many customization options.
Verified user Market Research via G2 -
The embedding function allows us to generate insights of our data for our audience and customers by far less than half of the usual time needed before.
Verified user Leisure, Travel & Tourism via G2

We now work much more efficiently, giving us more time to take care of the derivations and insights from the data for the customers.
The platform in detail
Common questions about sales dashboards
What is a sales dashboard?
Can DataLion connect to my CRM?
Which sales KPIs can I visualize?
Can I export a board or QBR deck to PowerPoint?
Is our sales data secure?
Ready to put your sales data on one dashboard?
Try DataLion free with your own pipeline and revenue data — from CRM export to live dashboard. Or book a personal demo and see the platform live.