The codebook — the metadata engine behind every dashboard
Define variables, value labels, chart types, the navigation, net rows and filters once — in the codebook. It is the quiet engine between import, analysis and dashboard: it keeps trackers consistent across every wave and makes any dataset instantly chartable.
The codebook is DataLion’s central metadata engine. It defines variables, value labels, chart types, the navigation hierarchy, net rows and formulas, missing values and per-variable filters — once. DataLion builds it automatically from labelled datasets; it is editable online with an Excel round-trip. That is what makes trackers consistent across waves.
- 🇩🇪 Made in Munich
- GDPR-compliant
- DPA included
- Hosted in Germany
Trusted by research, insights & media teams
- 50+ interactive chart types
- 20+ statistical methods
- SPSS · Excel · CSV import without data loss
- ISO 27001 certified data centers (Germany)
Without central metadata, every tracker falls apart
- Labels, chart types and filters live scattered across individual charts — every new wave is patched by hand.
- Net rows like "Top-2-Box" and derived variables are rebuilt in every report, and every deviation is a risk.
- A dashboard’s menu structure is dragged together by hand instead of coming from one source — never truly comparable across studies.
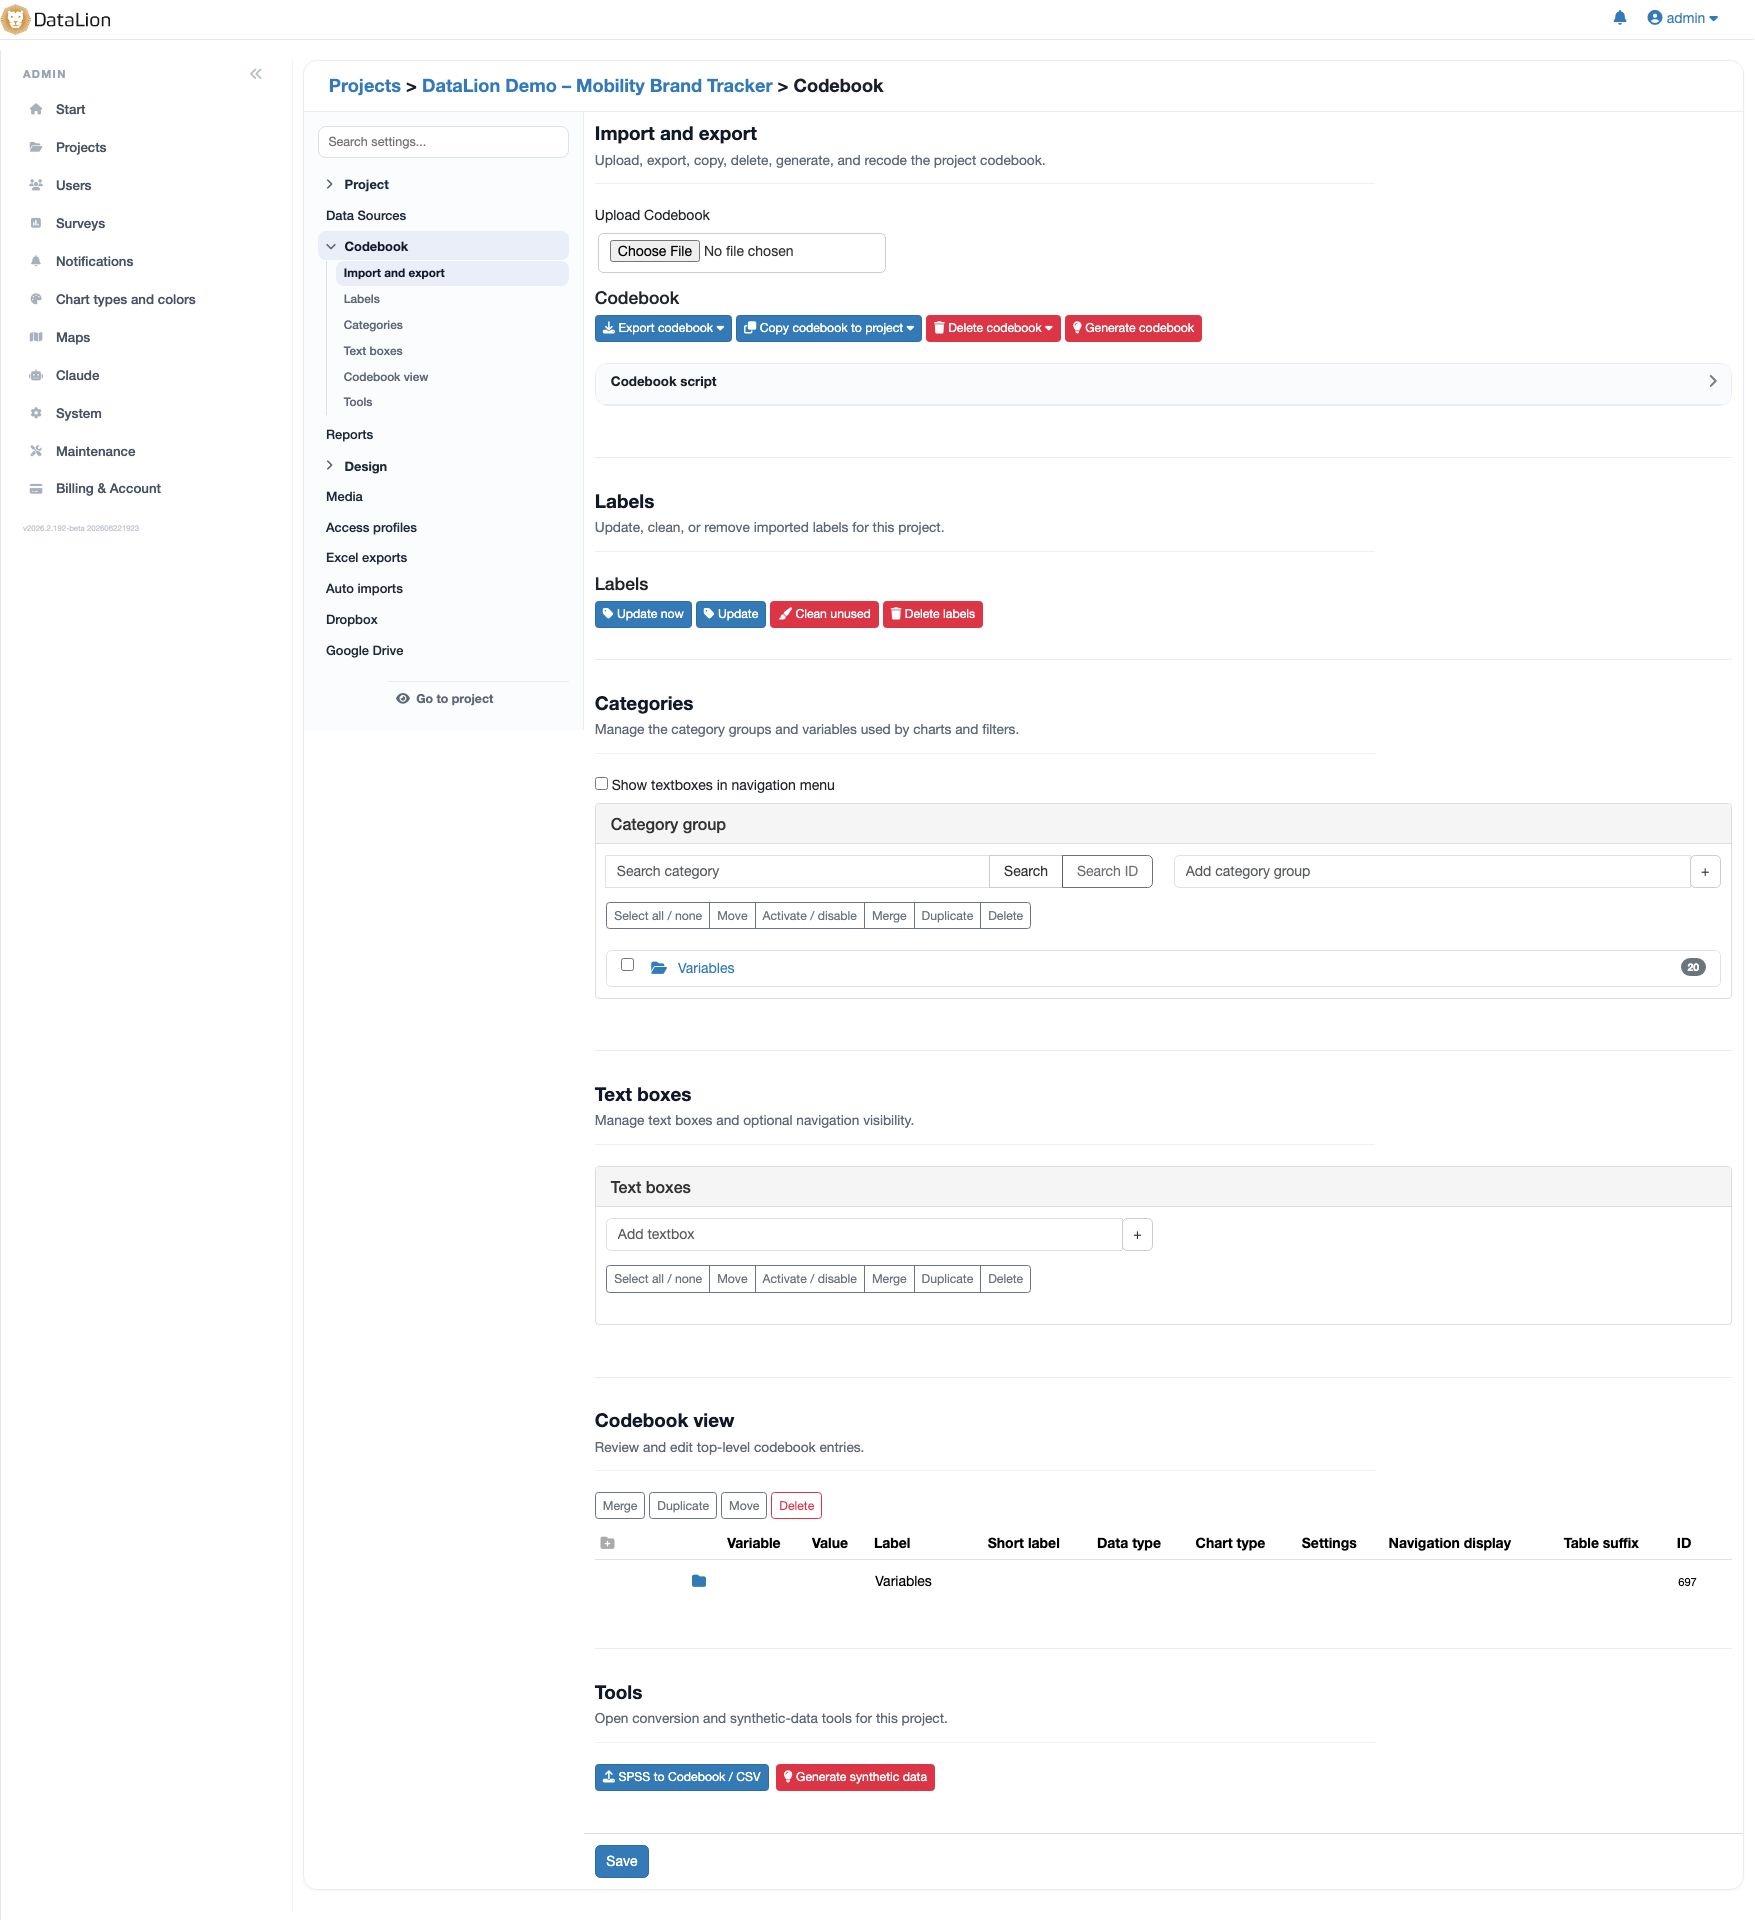
Every piece of metadata defined in one place
The codebook is the single place where DataLion knows everything about your data. Here you set variables, value labels, the right chart type, net rows with formulas, missing values and per-variable filters — once, in one place.
Charts, tables, reports and exports all draw from this one definition. Change a label or a net formula and it changes everywhere — no patching across dozens of charts.
- Variables and value labels as a single source of truth
- Chart type and missing values stored per variable
- Net rows and their formulas maintained centrally
- Per-variable filters — consistent across the whole project
Dashboard navigation comes from the codebook
Your dashboard menus are not built at random — they come from the codebook: using Level_1 and Level_2 menus you arrange variables into a clean navigation hierarchy.
This is why trackers stay consistent: every new wave and every related study inherits the same structure. Define a navigation once and you find your way around every project instantly.
- Navigation hierarchy via Level_1 and Level_2 menus
- The same structure across all waves and studies
- Instantly chartable instead of laboriously clicked together
Generated automatically, editable online, Excel round-trip
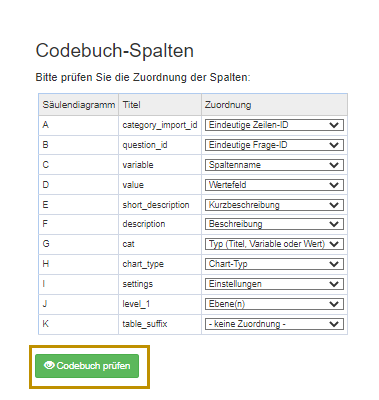
You never start from scratch: from a labelled dataset — such as SPSS, Excel or CSV — DataLion builds the codebook automatically. For open numeric and text variables it inserts placeholders like <num> and <label> for you to fill in.
You refine it in the online codebook editor — or via the Excel round-trip: export the codebook, adjust it in Excel, import it back. That lets even large teams work on the same metadata foundation.
- Automatic generation from labelled datasets
- Placeholders
<num>/<label>for open variables - Online editor in the browser
- Excel round-trip: export, adjust, import
Codebook scripting: stack, merge, automate
The codebook doesn’t just describe your data — it shapes it. With the codebook script you create derived questions and restructure variables in series, without touching the raw dataset.
Use "multistack" to stack many variables into one question — ideal for stacked charts from multiple variables; "union" merges variables into one shared question, and "single" bundles 0/1 dummies into a multiple-response question. Wildcards like q_% grab whole variable families at once — defined once as a script, DataLion re-applies it automatically on every new wave.
- Stack (
multistack), merge (union) or bundle into multiple-response (single) - Stacked charts from multiple variables — via script
- Wildcards (
q_%) recode whole variable families at once - Defined once, re-applied automatically every wave — raw data stays untouched
Calculated variables and alternative bases via SQL
For demanding analysis you compute right in the codebook: in the Value column you place SQL expressions to create calculated variables or alternative bases — for instance a net row on a different population.
That keeps the logic where the metadata lives: central, versioned through the codebook and consistent in every chart that uses it.
- SQL expressions directly in the Value column
- Calculated variables without touching the raw data
- Alternative bases for net rows and special analyses
See DataLion with your own data
Start a free trial or book a personal demo — from raw data to a finished dashboard.
What users say about DataLion
-
Very professional company, attentive to the customer needs, provider of a great software and service.
Generoso M. CRM Analyst · Automotive via G2 -
The contacts at DataLion are very committed. If you have problems, you can count on help. DataLion reacts quickly to requests for new functions.
Robert Q. Managing Director via G2 -
User-friendliness, especially for market research topics. Structured backend with many customization options.
Verified user Market Research via G2 -
The embedding function allows us to generate insights of our data for our audience and customers by far less than half of the usual time needed before.
Verified user Leisure, Travel & Tourism via G2

We now work much more efficiently, giving us more time to take care of the derivations and insights from the data for the customers.
More platform features
Guides in the help center
Common questions about the codebook
What is the codebook in DataLion?
Do I have to build the codebook by hand?
Can I edit the codebook in Excel?
How do I create derived questions or merge variables?
Can I compute in the codebook, for example define alternative bases?
Build your first codebook
Try DataLion free and let a codebook be built automatically from your labelled dataset — or see in a demo how the metadata engine keeps trackers consistent.