Dashboards for Associations & Membership Organizations
Turn the studies you publish to members into interactive, self-service dashboards — so members can explore the data, benchmark themselves and dive deeper, instead of reading a static PDF. ISO 27001-certified hosting, GDPR-compliant, made in Munich.
DataLion is a web-based dashboard platform, made in Munich, that lets associations publish their studies and statistics as interactive dashboards instead of static PDFs. Members filter, drill down and benchmark themselves against the sector, you control access with fine-grained rights and roles, and recurring studies refresh automatically — ISO 27001-certified hosting and GDPR-compliant.
- 🇩🇪 Made in Munich
- GDPR-compliant
- DPA included
- Hosted in Germany
Trusted by research, insights & media teams
- 50+ interactive chart types
- 20+ statistical methods
- SPSS · Excel · CSV import without data loss
- ISO 27001 certified data centers (Germany)
Your studies deserve more than a PDF
- You invest months in a study, then send it out as a static PDF nobody can explore.
- Members ask for cuts and benchmarks you can't give them without re-running the analysis.
- The data could be a member benefit or a revenue stream — but only if members can interact with it.
From a static PDF to a living dashboard
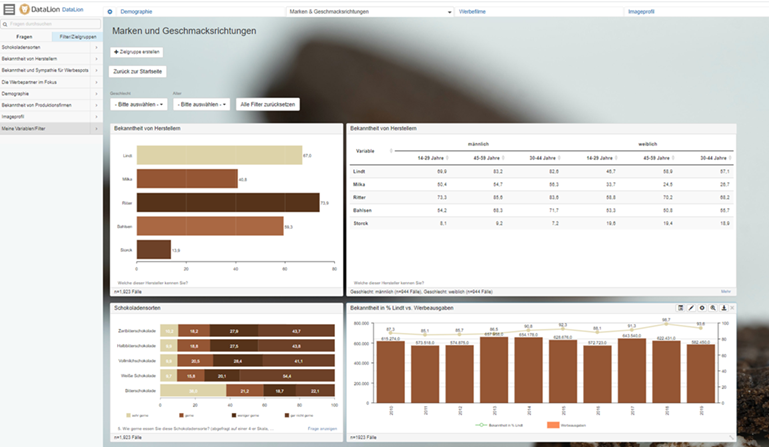
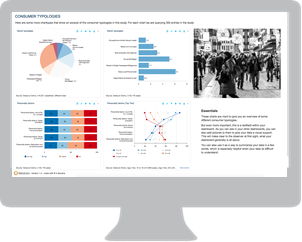
Associations regularly publish studies, market data and statistics — and usually send them as a PDF or Excel file. Publishing them as interactive DataLion dashboards makes the same data far more valuable: members stop reading a fixed report and start exploring the numbers that matter to them.
Build the dashboard once by drag & drop — no programming, no manual — and give members a living report they can return to all year, on any device.
- Interactive dashboards instead of static PDF or Excel
- Built by drag & drop — no programming required
- One living report members return to, not a one-off download
- Works on smartphone, tablet and desktop, with a fullscreen mode
Let members filter, drill down & benchmark
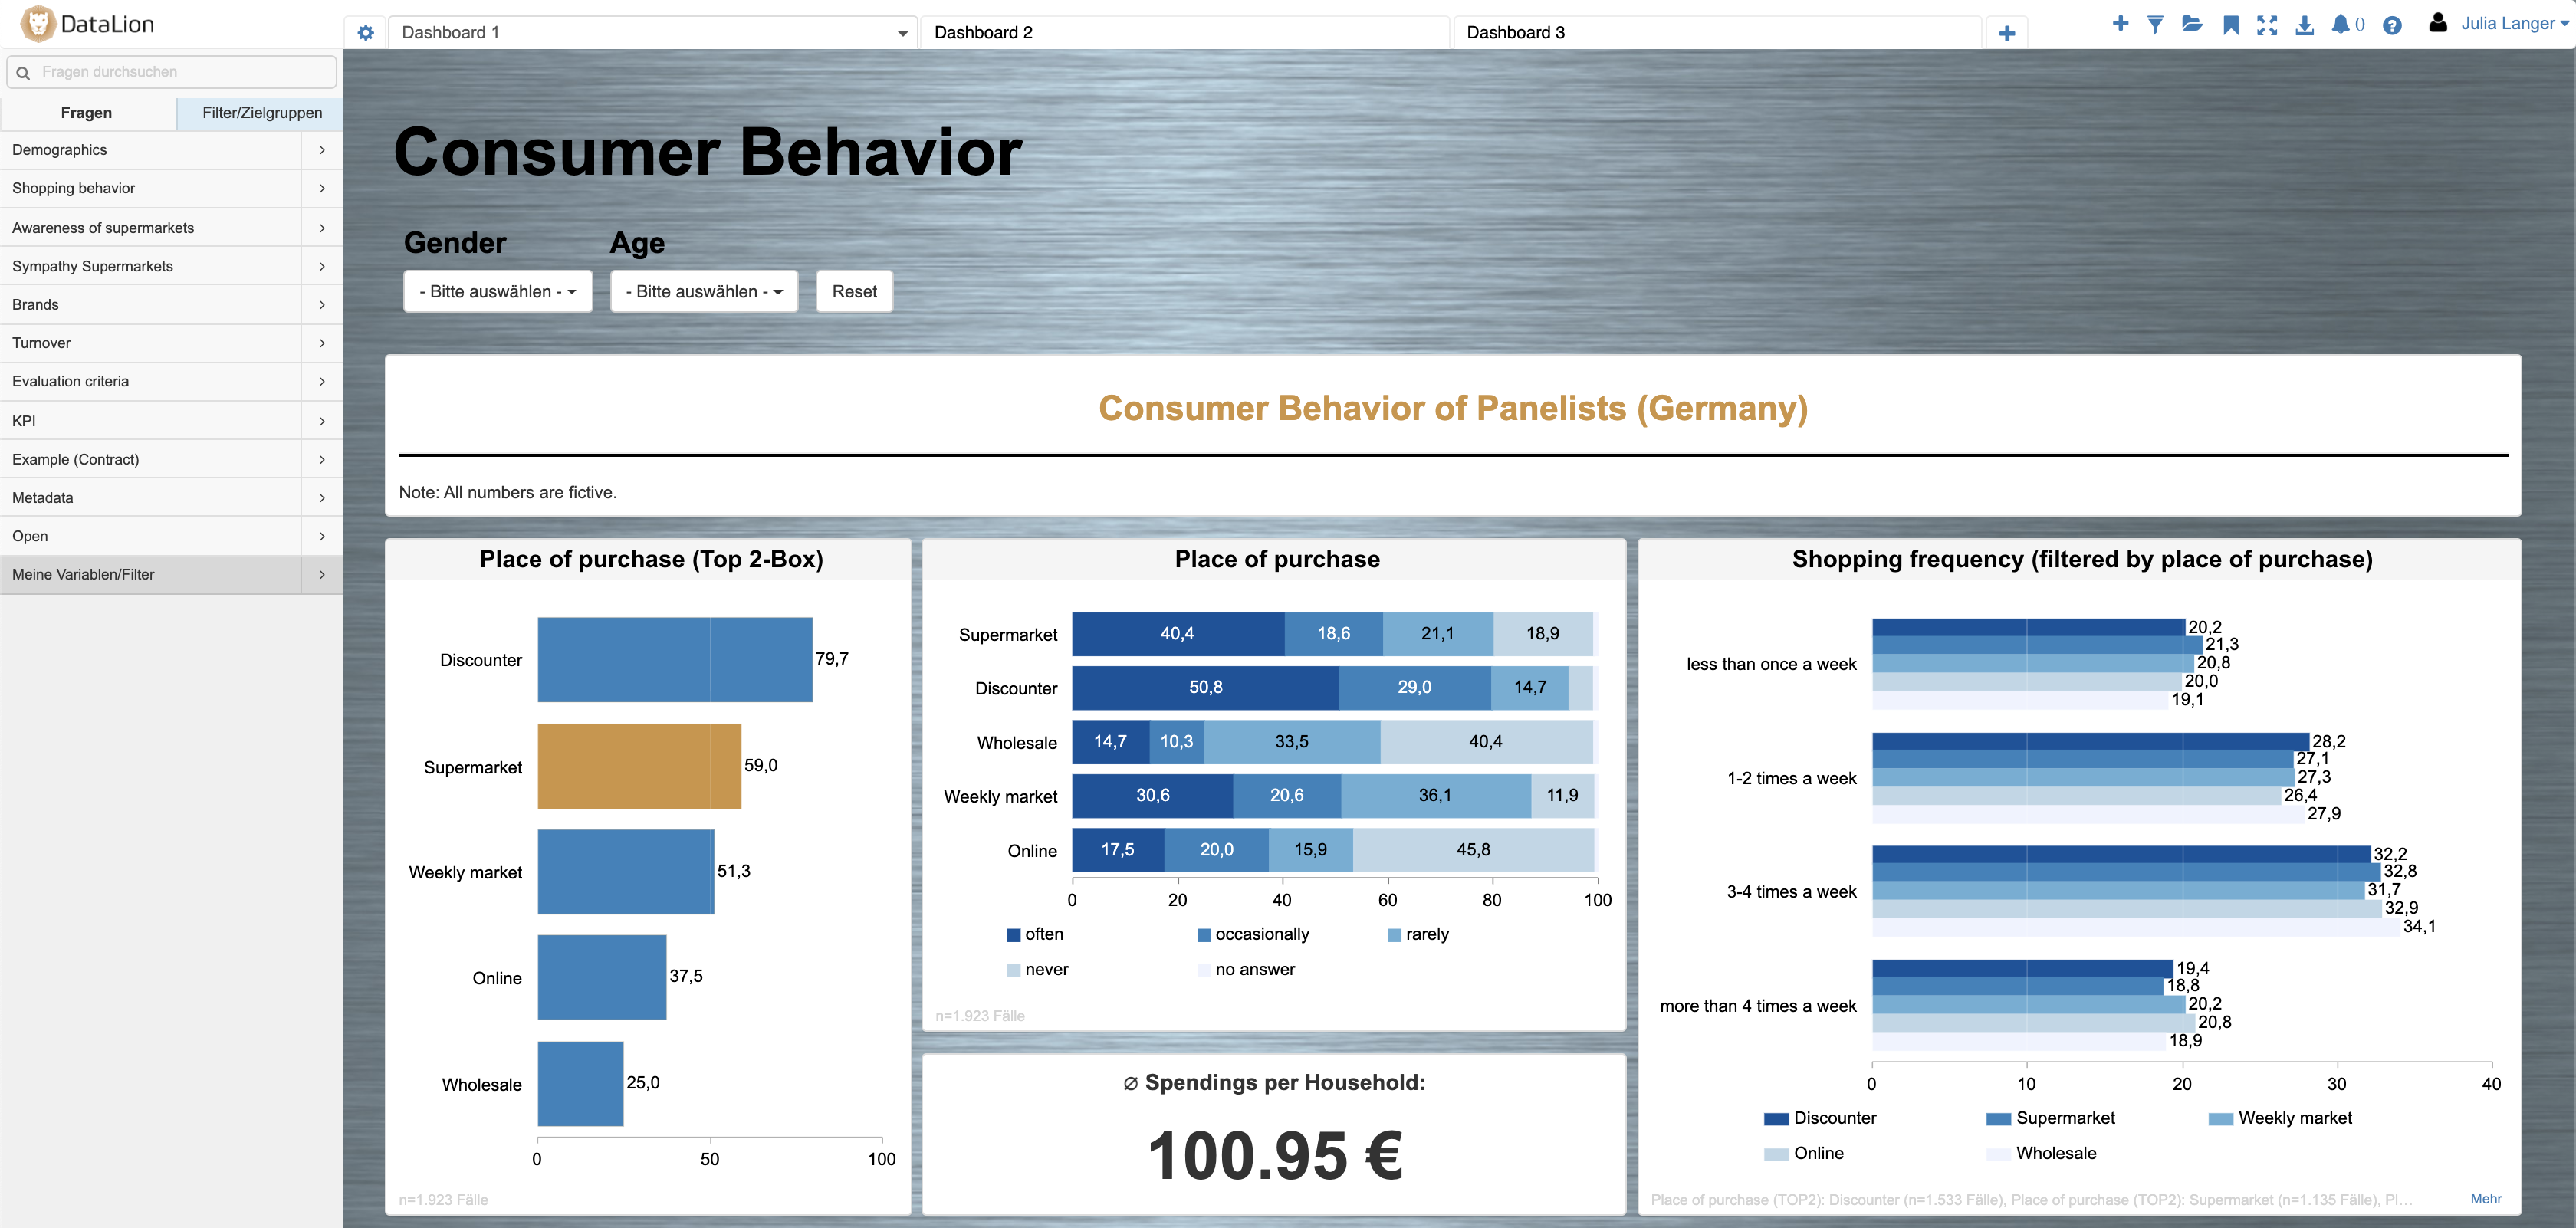
Give your members the data the way they want it. They filter live by region, segment or company size, drill down into the detail and benchmark themselves against the sector average — turning your study into a tool they actually use.
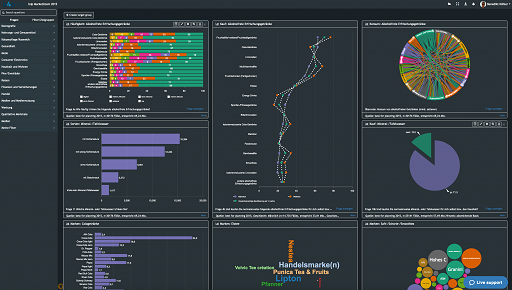
More than 50 interactive chart types — from bars and donut to heatmaps and maps — present every result clearly, so even complex industry statistics are easy to read.
- Live filters & drill-downs by region, segment or company size
- Members benchmark themselves against the sector average
- 50+ interactive chart types for clear, compelling results
- Mobile and fullscreen ready for any member, anywhere
Run the member survey and publish it in one place
Many association studies start with a survey of the membership. With DataLion you can run that survey too: 20+ question types, skip and display logic, and invitations via link, QR code or embed. Answers become structured variables automatically — no export.
From the same data you build the published dashboard in a few clicks. So the whole study — from member survey to interactive report — lives in one platform. More on the survey software.
- 20+ question types with skip & display logic
- Invite members by link, QR code or website embed
- Answers become variables automatically — no export
- From the member survey straight into the published dashboard
Tiered access — free subset, premium deep-dives
You decide exactly who sees what. With fine-grained rights and roles you can show every member a free subset of the study and reserve the deeper analysis for premium members — a simple way to make your studies a member benefit, or a source of revenue.
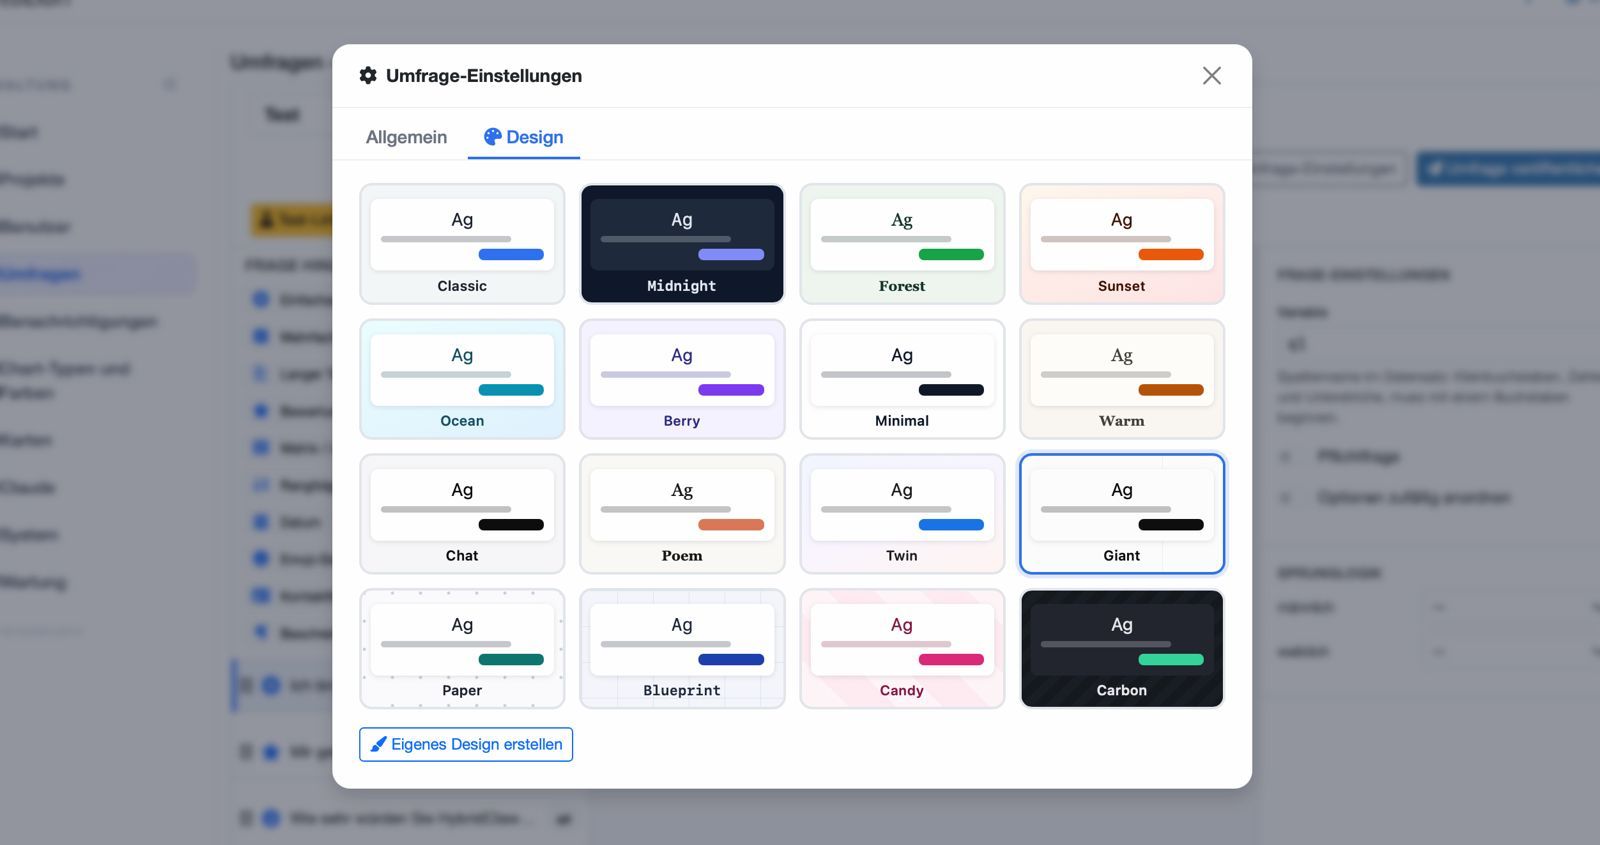
Embed the dashboards directly in your member portal or on your website, fully in your association’s corporate design, so the report looks and feels like part of your own platform.
- Rights & roles control who sees which part of a study
- Offer a free subset and charge for premium deep-dives
- Embed dashboards in your member portal or website
- Fully in your association’s corporate design
Export & auto-refresh for recurring studies
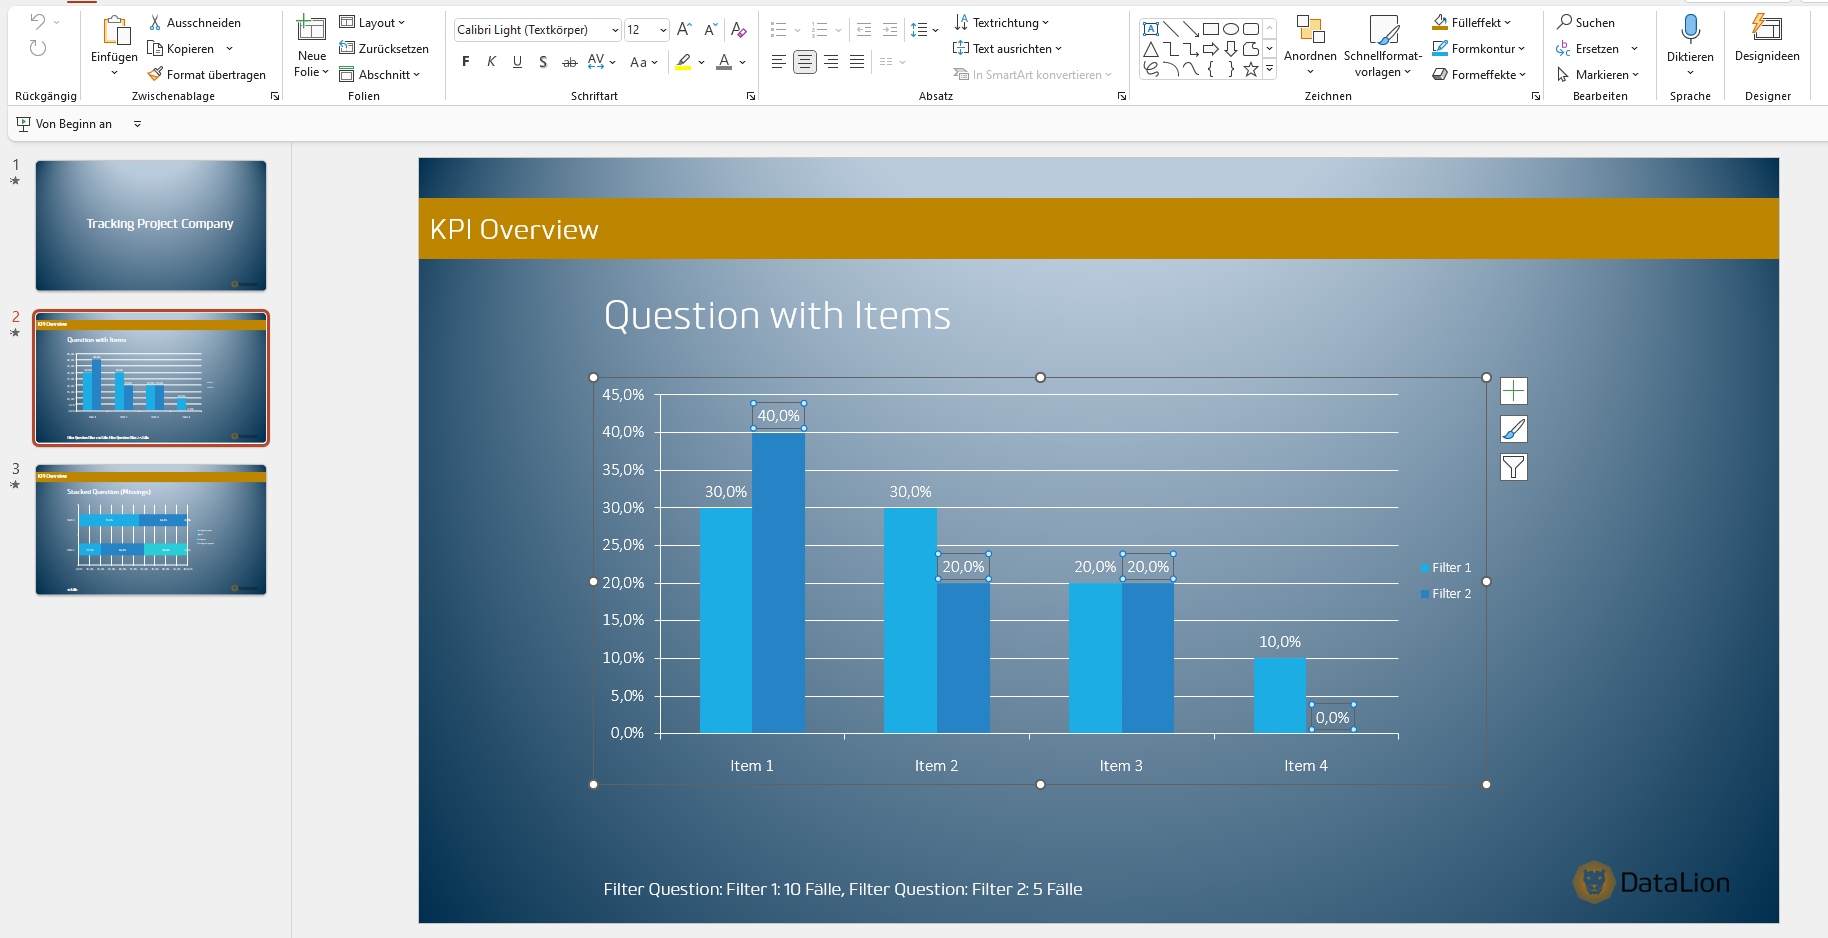
When you still need a classic file, export any chart or dashboard as natively editable PowerPoint, Excel, PDF or image — in your own layout and PowerPoint master. A full report for the board or the annual meeting takes minutes instead of days.
For studies you publish every year or quarter, set the dashboards up once: they refresh automatically with each new wave of data, including recoding — so the next edition is ready without rebuilding it.
- Native PowerPoint, Excel, PDF & image export in your CI
- A complete report in minutes, not days
- Recurring studies refresh automatically, wave after wave
- Automatic import and recoding for the next edition
AI assistance — and member data kept safe
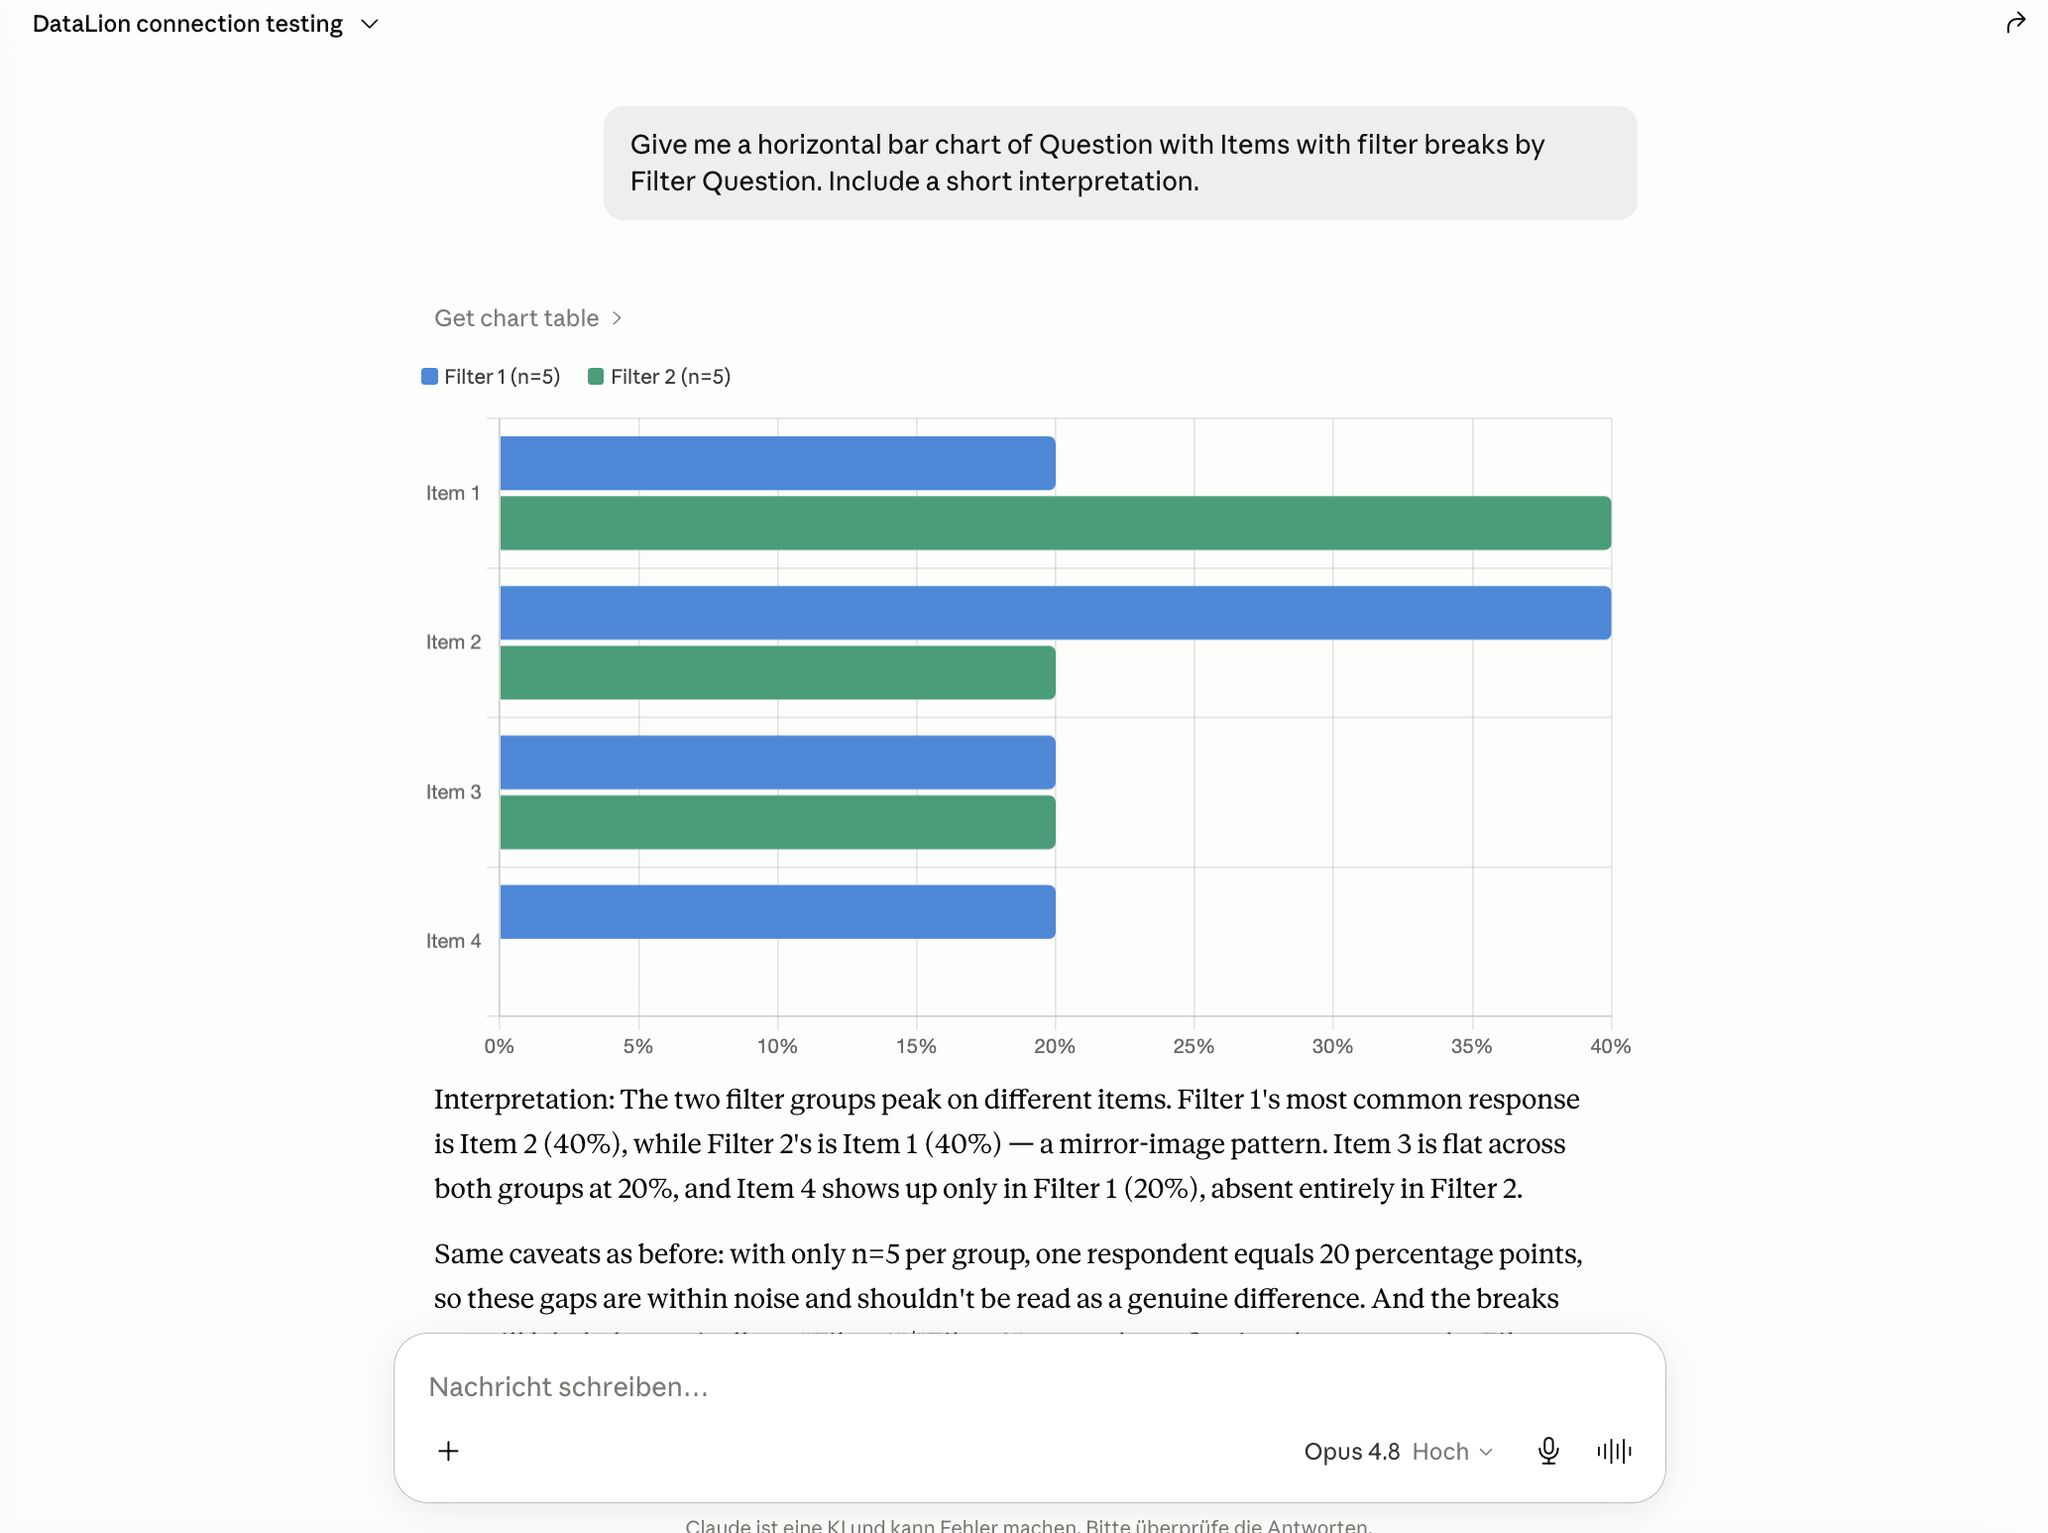
Through the Model Context Protocol (MCP) you can connect DataLion to AI agents like Claude and have them build dashboards or assemble reports in plain language — read-only by default and with scoped API tokens.
Member and respondent data deserves protection. DataLion runs in ISO 27001-certified data centers in Germany, is 100% GDPR-compliant with a Data Processing Agreement, and offers on-premise hosting and IP-restricted access. Learn more on the AI & automation page.
- Optional MCP integration for Claude — read-only by default
- ISO 27001-certified data centers in Germany, 100% GDPR-compliant
- Data Processing Agreement, on-premise & IP-restricted access
- A new DataLion version every two weeks
What you can build with DataLion
See DataLion with your own data
Start a free trial or book a personal demo — from raw data to a finished dashboard.
What users say about DataLion
-
Very professional company, attentive to the customer needs, provider of a great software and service.
Generoso M. CRM Analyst · Automotive via G2 -
The contacts at DataLion are very committed. If you have problems, you can count on help. DataLion reacts quickly to requests for new functions.
Robert Q. Managing Director via G2 -
User-friendliness, especially for market research topics. Structured backend with many customization options.
Verified user Market Research via G2 -
The embedding function allows us to generate insights of our data for our audience and customers by far less than half of the usual time needed before.
Verified user Leisure, Travel & Tourism via G2

We now work much more efficiently, giving us more time to take care of the derivations and insights from the data for the customers.
The platform in detail
Common questions from associations
How can our association publish a study as a dashboard?
Can we charge members for premium insights?
Can we run the member survey in DataLion too?
We publish the same study every year — does it update automatically?
Is our members’ data secure and GDPR-compliant?
Ready to make your studies interactive?
Try DataLion free and turn one of your studies into a self-service member dashboard. Or book a personal demo and see the platform live.