Driver analysis: what really moves your outcome
Use relative-importance analysis to find which factors drive NPS, satisfaction or loyalty most — computed on the R engine, directly on your weighted data. No export, no R code.
Driver analysis in DataLion is a relative-importance analysis: it decomposes the explained variance of an outcome like NPS or satisfaction across the individual drivers and shows which factors explain the result most. It runs on the R engine, complemented by regressions — directly on your weighted data.
- 🇩🇪 Made in Munich
- GDPR-compliant
- DPA included
- Hosted in Germany
Trusted by research, insights & media teams
- 50+ interactive chart types
- 20+ statistical methods
- SPSS · Excel · CSV import without data loss
- ISO 27001 certified data centers (Germany)
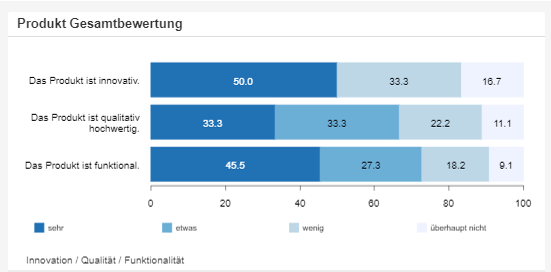
Which drivers explain your outcome
The score alone does not tell you why it moves. In DataLion, driver analysis is a relative-importance analysis: it decomposes the explained variance of an outcome across the individual influencing factors and shows which drivers contribute most.
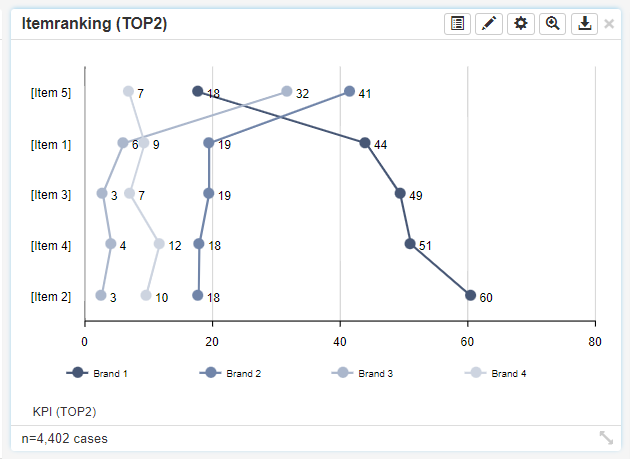
The result is a clear ranking: which factor explains the most, which barely any? So you steer resources toward the drivers that actually move the outcome — instead of gut feeling.
- Variance decomposition across the individual drivers
- A clear ranking by importance
- Focus on the factors with real leverage
- Robust prioritization instead of gut feeling
Computed on your data — with no export
Relative-importance analysis is one of the 20+ predefined procedures on DataLion's R engine and runs directly on your weighted dataset. To complement it, you run regressions — linear, ordinal and more — to check the direction and strength of individual effects.
No export to R, SPSS or Python, no re-importing: driver analysis and regression run on the same data as your crosstabs and charts.
- Relative importance as a predefined R procedure
- Computed on weighted data
- Complemented by linear and ordinal regressions
- No data export, no R code
NPS, satisfaction and loyalty drivers
Driver analysis is the heart of modern customer surveys: which experience dimensions drive the Net Promoter Score? Which factors explain satisfaction or repurchase intent?
Drivers can be compared by segment — so you see whether price works differently for new customers than for existing ones. You also analyze the open why-question in a structured way as net codes.
- Drivers of NPS and satisfaction
- Repurchase and loyalty drivers
- Driver comparison by segment
- Complemented by structured open-ended responses
See DataLion with your own data
Start a free trial or book a personal demo — from raw data to a finished dashboard.
What users say about DataLion
-
Very professional company, attentive to the customer needs, provider of a great software and service.
Generoso M. CRM Analyst · Automotive via G2 -
The contacts at DataLion are very committed. If you have problems, you can count on help. DataLion reacts quickly to requests for new functions.
Robert Q. Managing Director via G2 -
User-friendliness, especially for market research topics. Structured backend with many customization options.
Verified user Market Research via G2 -
The embedding function allows us to generate insights of our data for our audience and customers by far less than half of the usual time needed before.
Verified user Leisure, Travel & Tourism via G2

We now work much more efficiently, giving us more time to take care of the derivations and insights from the data for the customers.
More analysis features
Common questions about driver analysis
What is driver analysis in DataLion?
What method is behind it?
What do I use a driver analysis for?
Can I compare drivers by segment?
Do I need to export data or know R?
Find out what drives your outcome
Try DataLion free: relative importance and regressions directly on your data — with no export. Or book a personal demo.